Definition: Nodal Analysis is a method used to evaluate a complete producing system by isolating a single point (the Node) and ensuring the pressure and flow rate are consistent across that point. In petroleum production, the most common node is the Bottom-hole, where the Inflow (IPR) meets the Outflow (VLP).
The Node Concept
For any given node, two conditions must be met:
- Flow into the node equals flow out of the node.
- Only one pressure can exist at the node at a given flow rate.
The Node Equations:
- Inflow (Supply):
- Outflow (Demand):
Determining the Operating Point
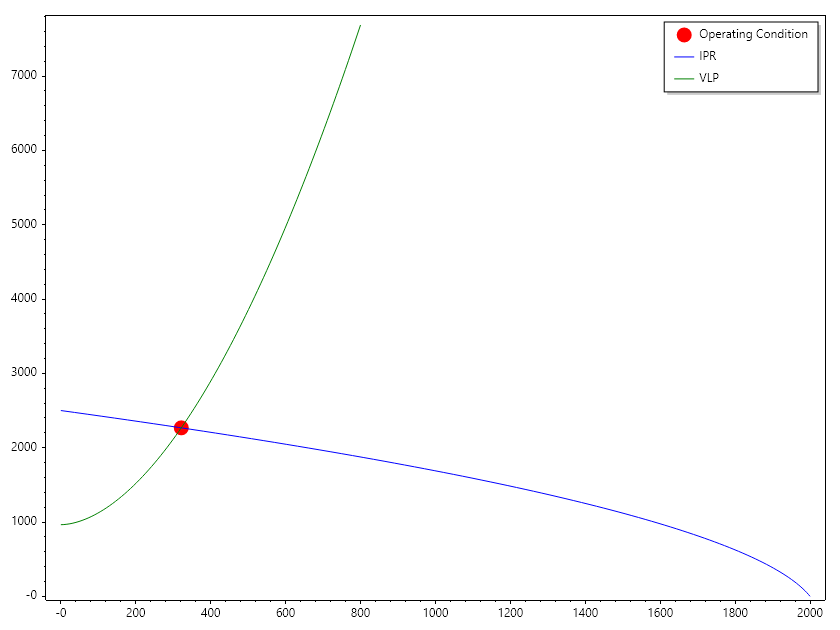
The intersection of the IPR curve and the VLP curve represents the Operating Point. This is the only rate (:math:q_{actual}) at which the well will naturally flow for a given set of conditions.
Numerical Example:
Consider a well with:
- Reservoir Pressure () = 3500 psi
- Productivity Index () = 1.2 STB/day/psi
- Surface Pressure () = 250 psi
- VLP is simplified as:
To find the operating point, we solve for where .
Example 1C#
Sensitivity Analysis
Nodal analysis is most powerful when performing "What-If" scenarios. By shifting the curves, engineers can predict the impact of changes:
| Change | Curve Affected | Result on Operating Point | |
|---|---|---|---|
| Increase Reservoir Pressure | IPR(Shifts Up) | Increase in and . | |
| Wellbore Stimulation(Skin < 0) | IPR(Gets Steeper) | Increase in :math: q. | |
| Increase Tubing Diameter | VLP(Shifts Down) | Increase in , decrease in . | |
| Increase Water Cut | VLP(Shifts Up) | Decrease in (due to heavier fluid). |
Stimulation Economics: A Nodal Analysis Case Study
Problem Statement: An oil company is evaluating two competing stimulation proposals to improve the productivity of a damaged well. The well is currently performing poorly due to a high skin factor (). The goal is to determine which intervention provides the best return on investment by calculating the production gain per million USD spent.
Reservoir and Well Data
| Parameter | Value | Unit |
|---|---|---|
| Reservoir Pressure() | 2800 | psia |
| Bubble Point() | 3000 | psia |
| Current Skin Factor() | +5 | dimensionless |
| Max Flow Rate(Ideal ) | 2000 | STB/day |
| Reservoir Radius / Wellbore Radius() | 1000 | dimensionless |
| Well Depth | 4000 | ft |
| Oil Density | 55.0 | |
| Surface Pressure() | 200 | psia |
Stimulation Offers:
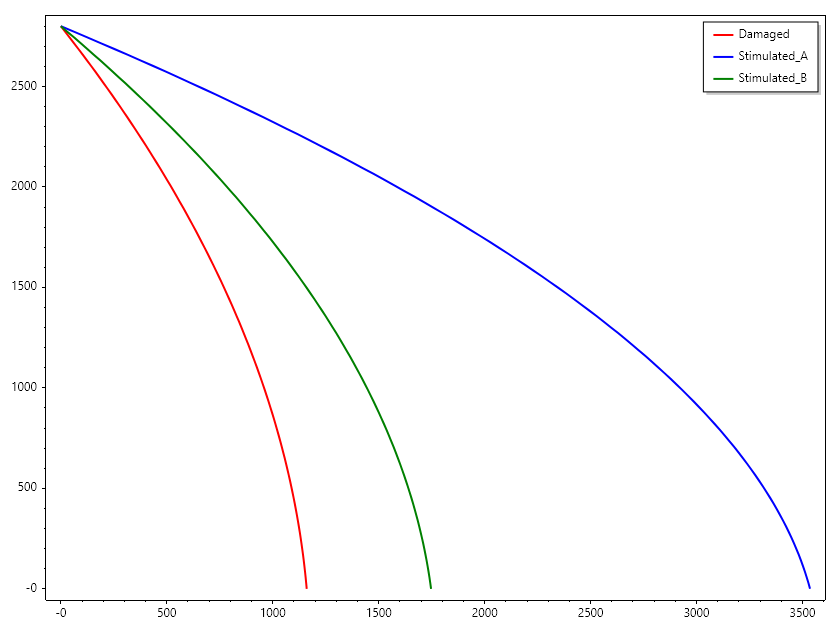
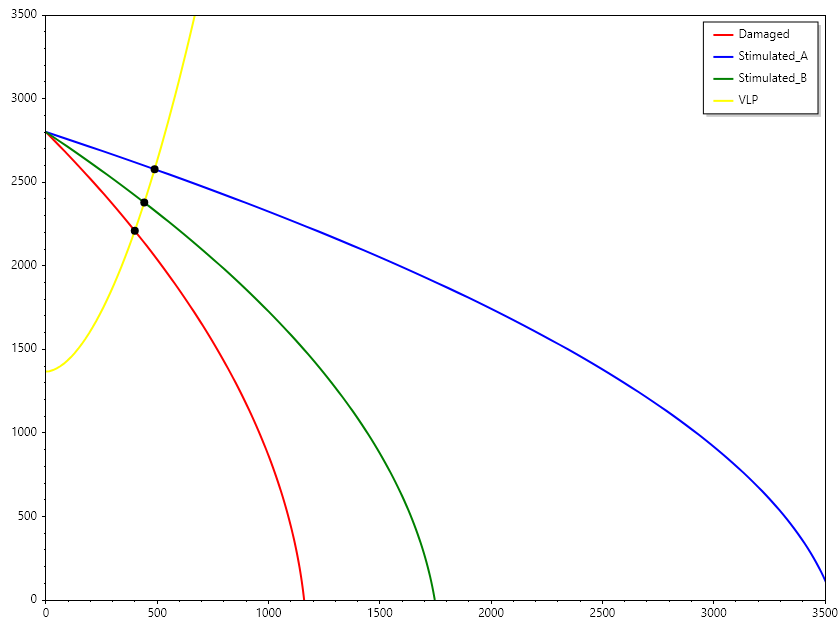
Company A(Hydraulic Frac):Reduces skin to . Cost: $10M. Company B(Acid Wash):Reduces skin to . Cost: $5M.
Solution - 1. Compute IPR and Flow Efficiency Since the reservoir pressure() is below the bubble point(), the well follows Vogel's non-linear behavior. We first determine the Flow Efficiency () for each skin scenario. The relationship between skin and productivity adjustment is:
Example 2C#
- 2. Compute the VLP
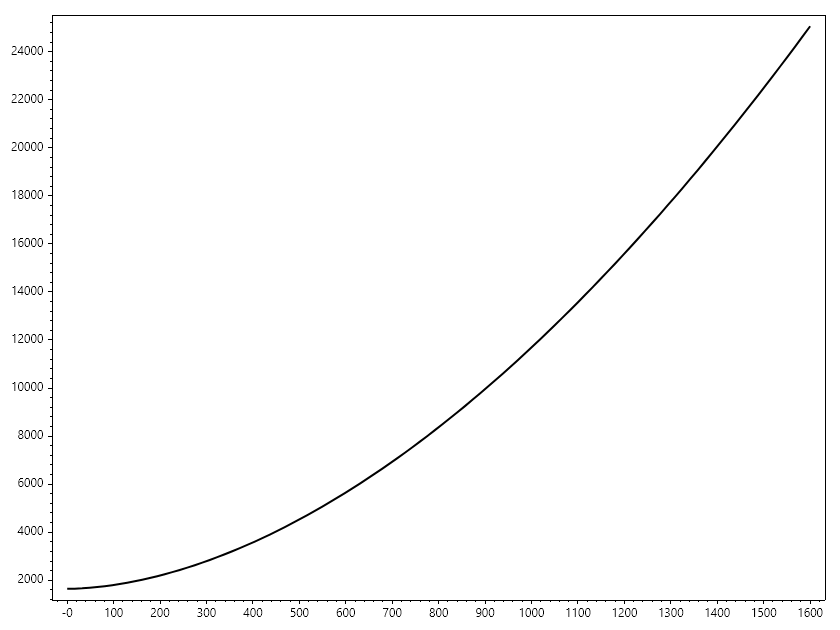
The Vertical Lift Performance is calculated by integrating the hydrostatic and frictional pressure drops from the surface to the bottom-hole.
Example 3C#
- 3. Nodal Analysis and Operating Points
We find the intersection where: math:p_{ wf, IPR} = p_{ wf, VLP} for each case using SepalSolver.
Example 4C#
- 4. Production Improvement and Economics
Example 5C#
Barrel Per Dollar for Quote A: 3.5733706107198175
Barrel Per Dollar for Quote B: 3.4741949196266146