Definition: PVT modeling describes the changes in hydrocarbon fluid properties (volume, density, and phase) as a function of pressure and temperature. It is essential for converting surface volumes (STB) to reservoir volumes (RB).
Key Properties & Symbols
- : Oil Formation Volume Factor (RB/STB)
- : Solution Gas-Oil Ratio (scf/STB)
- : Oil Viscosity (cP)
- : Specific gravities of oil and gas.
- The Bubble Point Pressure ():
The pressure at which the first bubble of gas comes out of solution. Below this pressure, the fluid is "saturated." A common correlation used is Standing’s method.
Numerical Example:
- :
Example 1C#
Bubble Point Pressure = 2486.40 psia
- Oil Formation Volume Factor(): Since oil shrinks as gas escapes, is almost always greater than 1.0.For pressures below the bubble point, we use the Standing correlation:
Numerical Example:
- (Typical for 35 API)
Using , - , and - from above:
Example 2C#
Bo at Bubble Point = 1.280 RB/STB
- Gas Compressibility Factor():
For gas modeling, the Ideal Gas Law fails at high pressure. We use the -factor to correct it. The Hall-Yarborough or Dranchuk-Abu-Kassam methods are standard for coding this.
Linearization for Gas Density:
Kareem et al, z factor correlation is a really good approximation and is described below.
given that
Example 3C#
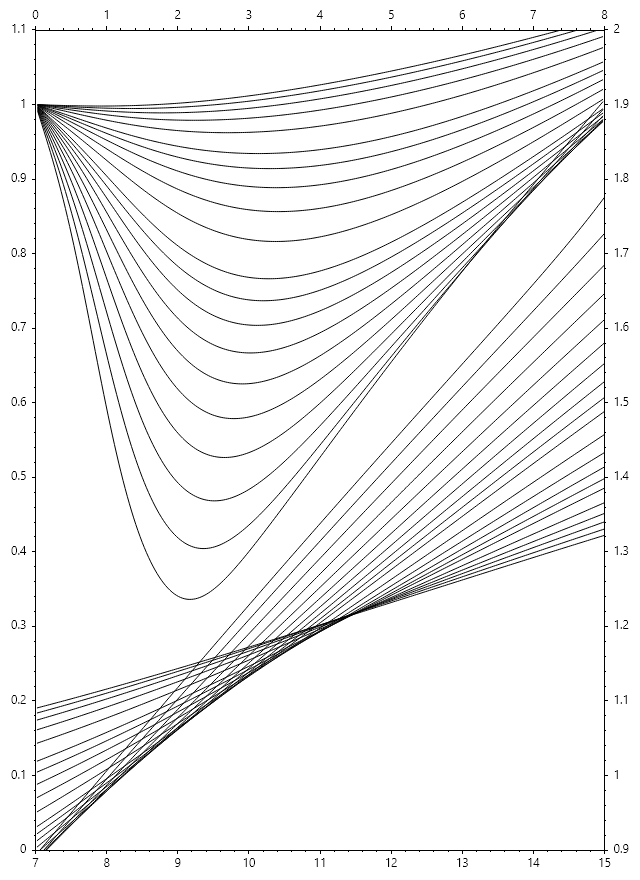
- Gas Formation Volume Factor( ) is the ratio of the volume of gas at reservoir conditions to the
volume of the same mass of gas at standard conditions. Because gas is highly compressible, is always a very small number (typically ).
Mathematical Expression: Derived from the Real Gas Law ():
Or in field units (res bbl/scf):
Where:
- = Reservoir pressure (psia)
- = Reservoir temperature ()
- = Gas deviation factor at and
5.Isothermal Oil Compressibility() Above the bubble point (undersaturated), the oil volume changes only slightly due to pressure.
Code Implementation for Undersaturated . If , we adjust the (at bubble point) using compressibility:
Example 4C#
Undersaturated Bo at 5000 psi = 1.271 RB/STB
Practical Application: Material BalanceWe combine these PVT parameters to calculate the Original Oil In Place (OOIP):
Bubble Point and Dew Point Pressures are critical for determining the phase behavior of reservoir fluids. The bubble point is the pressure at which gas begins to come out of solution in oil, while the dew point is the pressure at which liquid begins to condense from gas. These pressures can be estimated using correlations or laboratory PVT analysis.
Example 5C#
T = 760.00 K,
Bubble Point Pressure = 43922.21 psia,
Dew Point Pressure = 771.49 psia